Visualize Helm Chartsin Your Browser
An interactive Kubernetes resource graph — no cluster access, no Helm CLI required. Load charts from Artifact Hub, upload a .tgz, or render your workspace chart across every environment. Now with RBAC visibility, multi-theme support, and chart structure validation.
Everything you need to understand a Helm chart
From loading to diffing to exporting — the full workflow runs entirely in your browser.
See Every Resource at a Glance
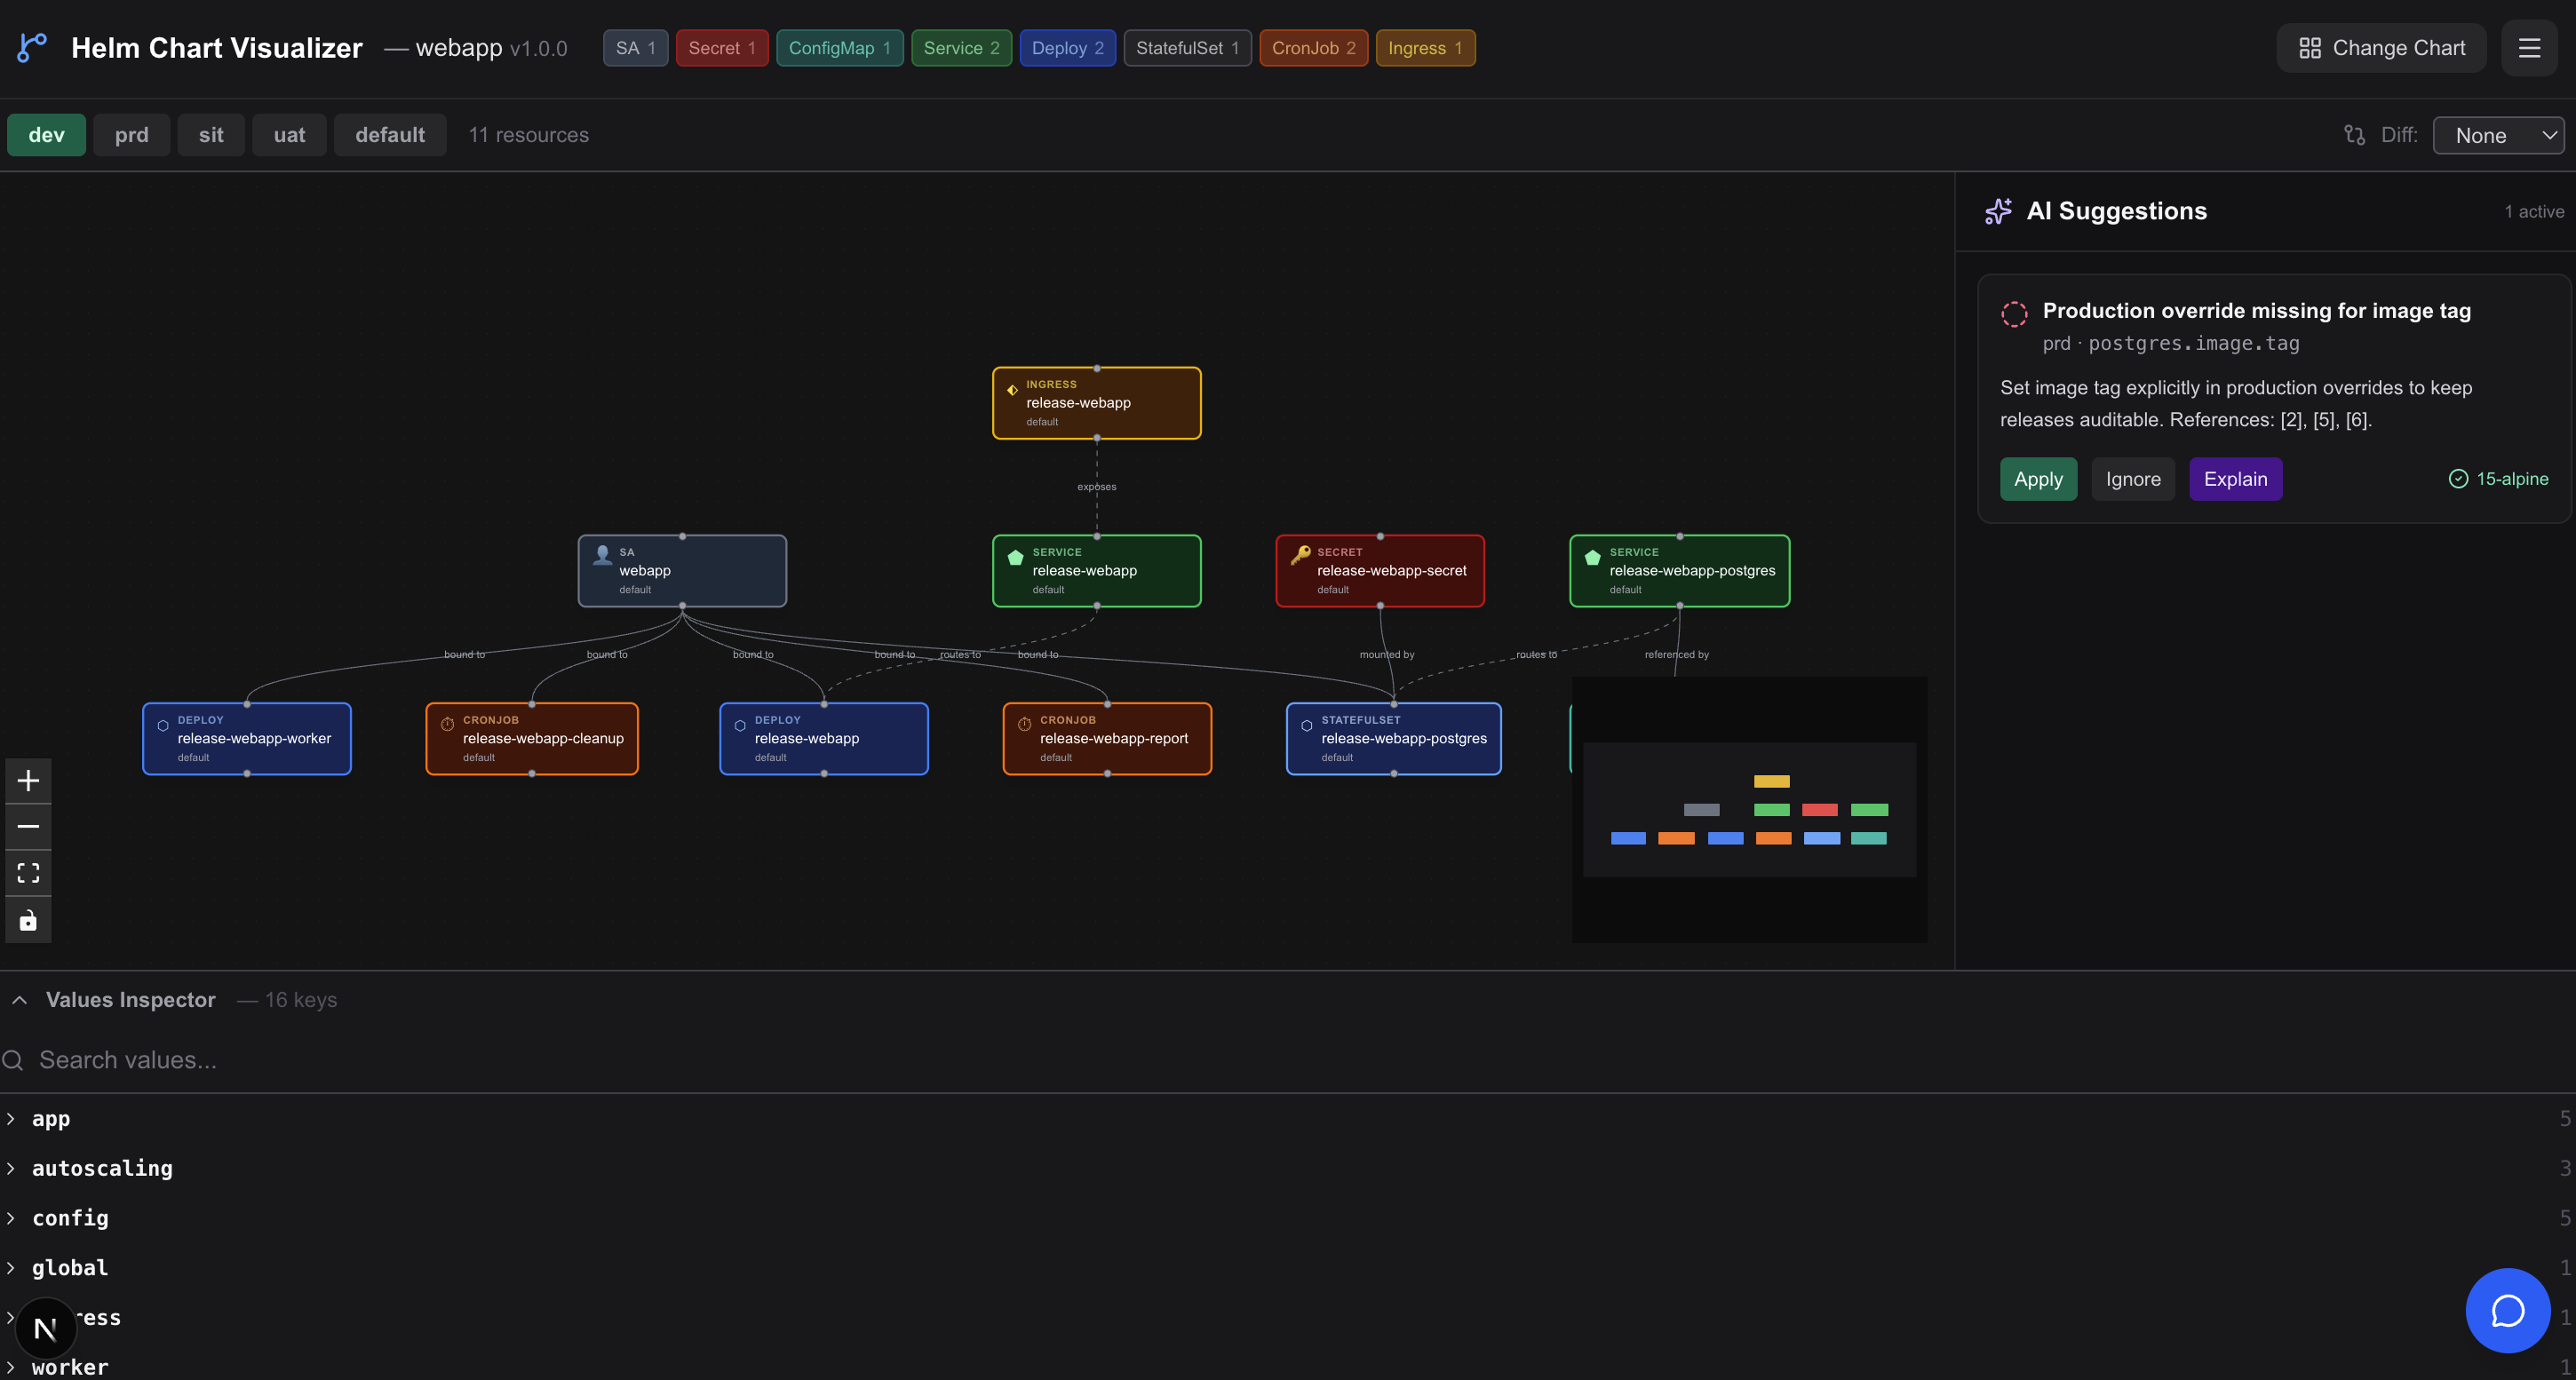
The auto-layout graph renders every Kubernetes resource in your chart — Deployments, Services, Ingress, ConfigMaps, Secrets, StatefulSets, CronJobs, HPAs, RBAC roles, bindings, and more. Edges show real relationships: routes to, exposes, bound to, mounted by, referenced by, binds.
- Color-coded nodes per resource kind
- RBAC nodes (ClusterRole, Role, Bindings) with privilege-flow edges
- Labeled relationship edges between resources
- Kind badge summary bar with live counts
- Pan, zoom, and fit-to-view controls
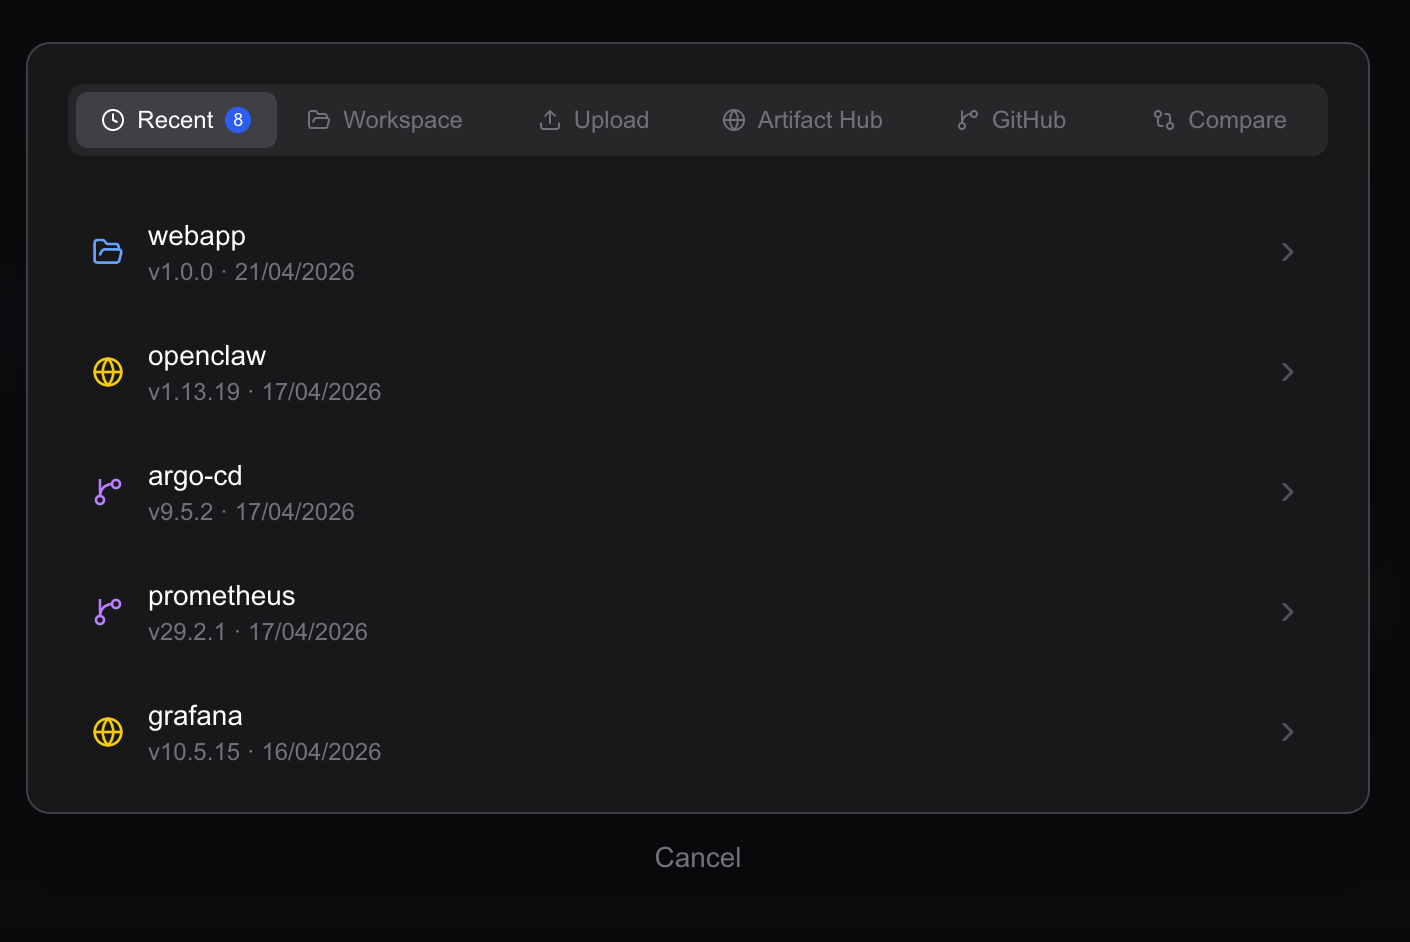
Load From Anywhere
Paste an Artifact Hub URL, drop a .tgz package, or let the app auto-load the helm/ directory from your workspace. Chart history persists in localStorage so your recent charts are always one click away.
- Artifact Hub & OCI registry support
- Drag-and-drop .tgz upload (up to 50 MB)
- Workspace auto-load from helm/ directory
- Recent chart history via localStorage
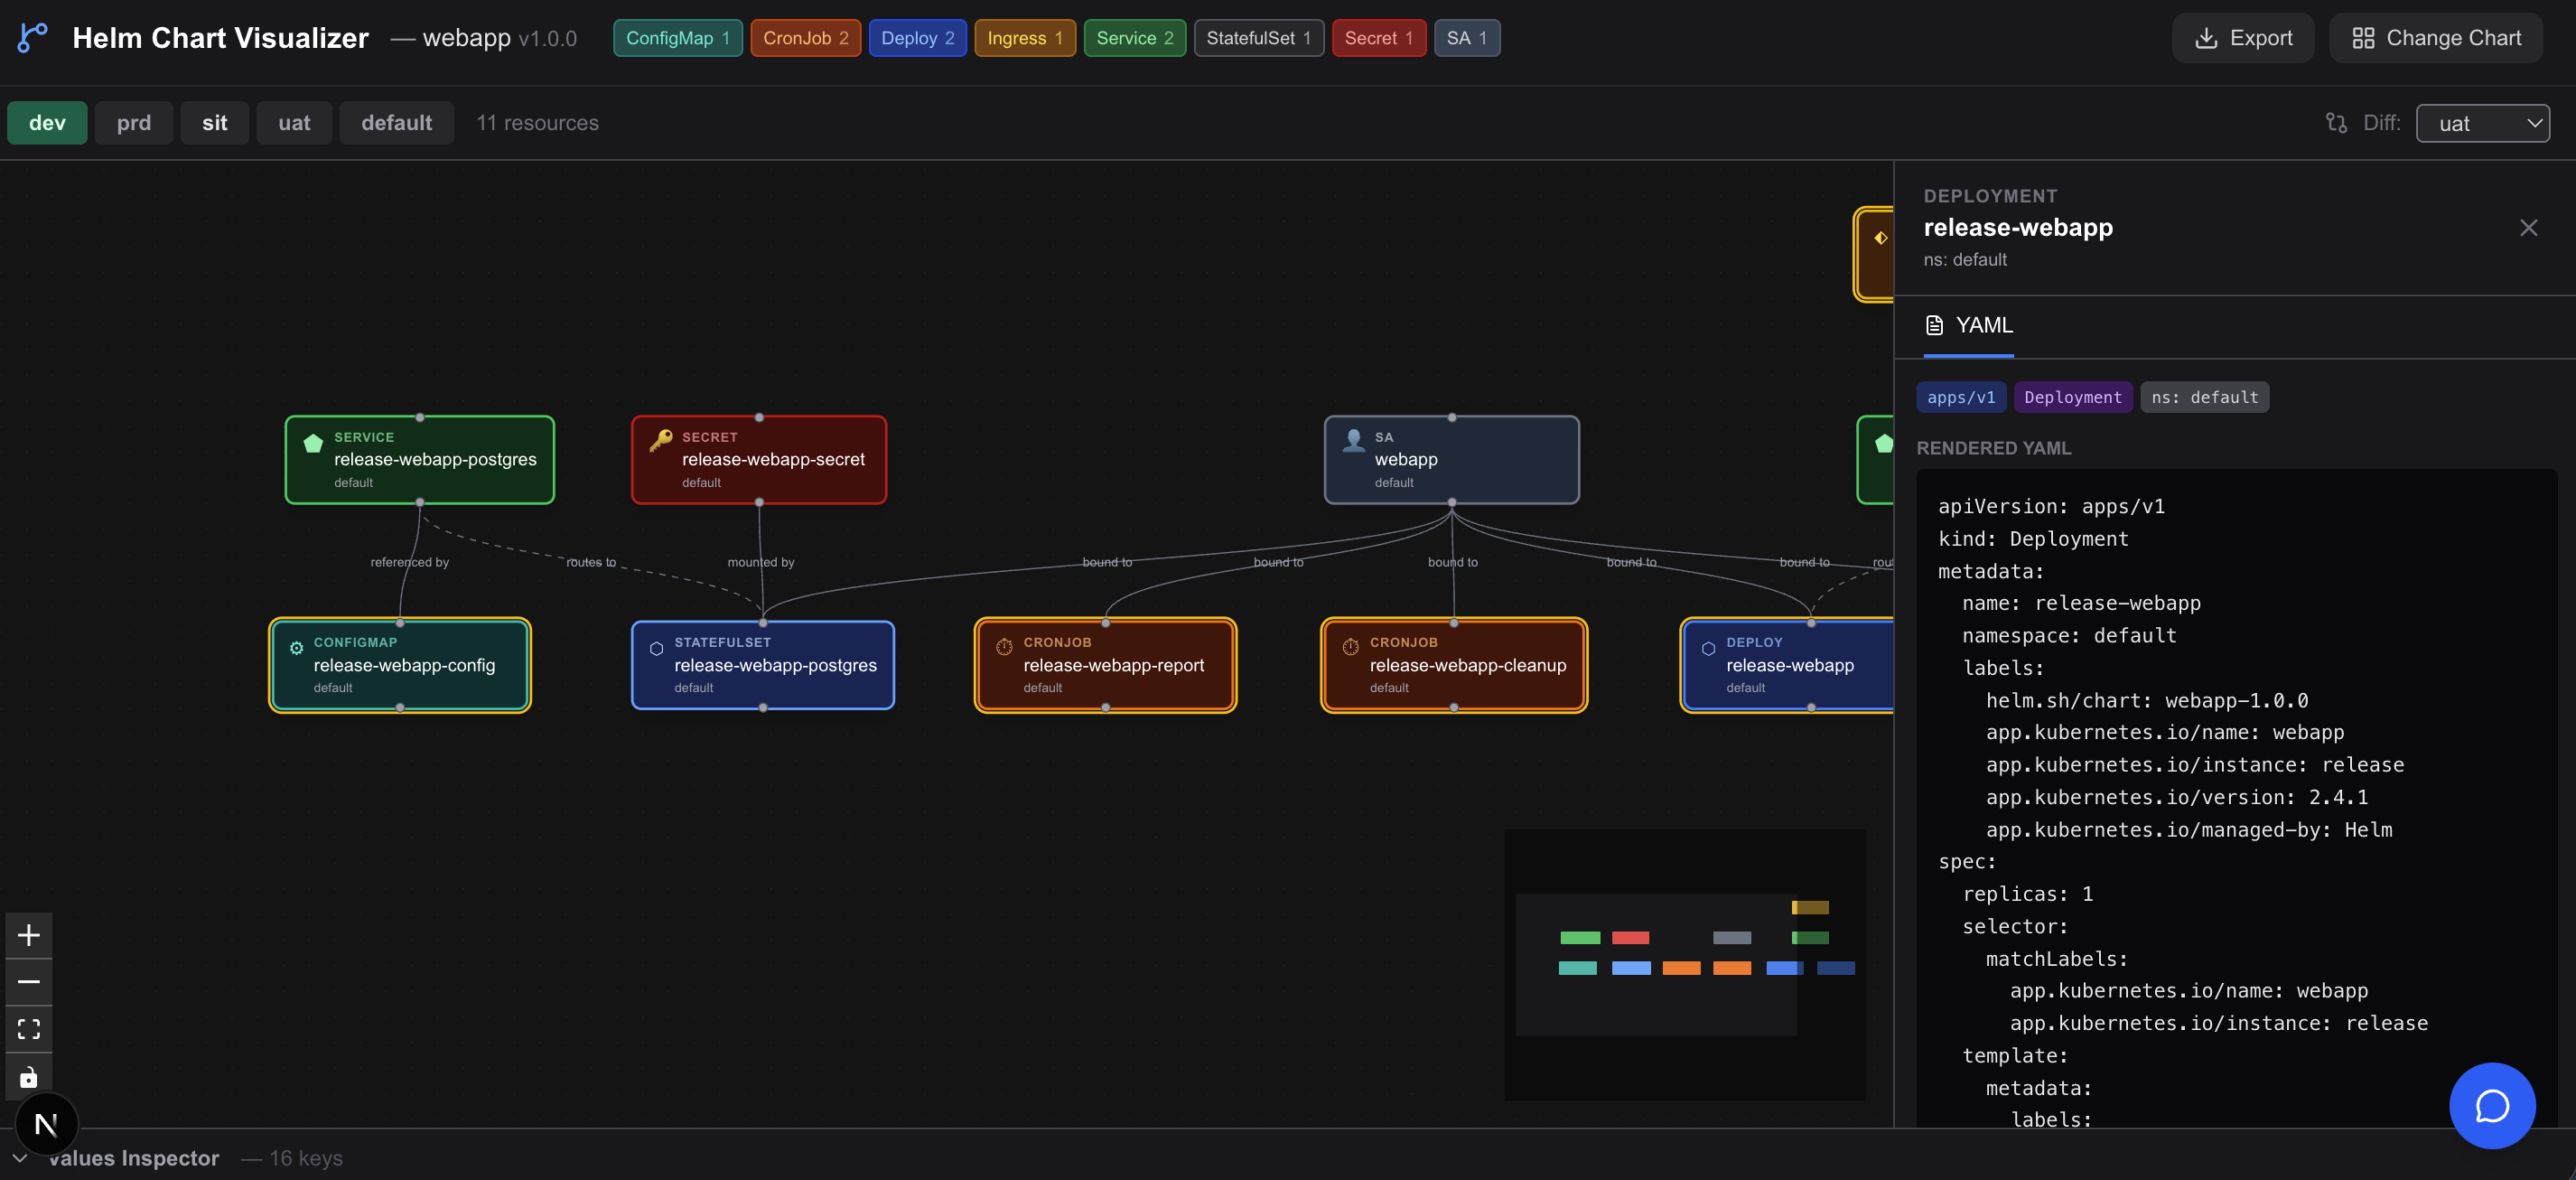
Drill Into Any Resource
Click any node to open a full YAML side panel with syntax highlighting. Switch environments, enable diff mode to see what changed, validate chart structure before rendering, choose Dark/Light/High-Contrast themes, export rendered manifests, and export graph snapshots/data (PNG, SVG, JSON, Markdown) — no cluster needed.
- Full rendered YAML per resource
- Multi-environment switcher (dev, sit, uat, prd)
- Amber highlight on changed resources in diff mode
- Chart validation: warnings & errors before rendering
- Dark, Light, and High-Contrast color themes
- One-click YAML export for the active environment
- Graph export as PNG, SVG, JSON, or Markdown
All the features, zero compromises
A complete toolkit for loading, visualizing, and analyzing Helm charts — all in the browser.
Workspace Chart
Auto-loads the helm/ directory in your repo and renders it across all environments.
Upload .tgz
Drag-and-drop any packaged Helm chart (up to 50 MB) for instant visualization.
Artifact Hub & OCI
Load charts directly from artifacthub.io URLs, including OCI-hosted charts.
GitHub URL Import
Paste any public GitHub repository URL to import and visualize its Helm chart directly — no download needed.
Live Search
Search the Artifact Hub API in real time — click a result to load it instantly.
Popular Charts
One-click quickload for nginx, grafana, cert-manager, postgres, and more.
Resource Graph
Interactive React Flow canvas with color-coded nodes for every Kubernetes resource kind.
Kind Badges
Header bar shows a live count of each resource kind. Click any badge to instantly filter the graph to that resource type.
Resource Relationships
Edges labeled routes to, exposes, bound to, mounted by, referenced by show how resources connect.
Resource Detail
Click any node to open a full rendered YAML panel with syntax highlighting.
Chart History
Recent charts persist to localStorage for quick re-access across sessions.
RBAC Graph
ClusterRole, Role, ClusterRoleBinding, and RoleBinding as first-class nodes with privilege-flow edges from subjects to roles.
Color Themes
Switch between Dark, Light, and High-Contrast themes from the toolbar — tokens propagate into the graph canvas.
Multi-Environment
Renders every values.<env>.yaml file and lets you switch between environments.
Env Diff
Select a comparison environment — changed nodes glow amber so differences are unmissable.
Values Inspector
Explore the merged values tree; hover to highlight which resources use each key.
Export YAML
Download all rendered manifests for the active environment as a single YAML file.
Graph Export
Export the visualization as PNG or SVG, or export graph data as JSON and Markdown.
Chart Validation
Checks for missing files, duplicate keys, and malformed templates before rendering, surfacing actionable warnings inline.
AI Chat Assistant
Ask plain-English questions about your chart: replicas, values usage, HPA config, and more. Responses render as formatted Markdown with syntax-highlighted code blocks.
AI Suggestions
An inline suggestions panel analyzes your chart against Helm best-practice defaults and surfaces actionable override recommendations to close the gaps.
Pure-JS Renderer
100+ Go template functions processed entirely in-browser — no Helm binary, no network calls at render time.
VS Code Extension (Beta)
Open any workspace Helm chart in the full Helm Visualizer UI directly from VS Code — no browser tab or separate server required.
How it works
Three steps. No signup. No cluster.
Load a Chart
Paste an Artifact Hub URL, drag-and-drop a .tgz package, search for any chart by name, or let the app auto-load your workspace helm/ directory.
artifacthub.io · .tgz upload · workspace chart · search
Explore the Graph
Browse the interactive resource graph. Click any node to view its full rendered YAML. Switch between environments to see how the chart changes across dev, sit, uat, and prd.
Pan · zoom · click for YAML · switch envs
Diff, Inspect & Export
Validate the chart for structural issues before rendering — missing files, duplicate keys, and template errors surface as inline warnings. Enable diff mode to highlight what changed between two environments. Use the Values Inspector to trace which resources use each value. Export manifests as YAML, or export the graph as PNG, SVG, JSON, or Markdown.
Validate · amber diff · values hover · YAML + graph export
Built with
Get started in 30 seconds
Clone the repo, install dependencies, and start visualizing.
# Clone and install
git clone https://github.com/unrealandychan/Helm-Visualizer
cd Helm-Visualizer
npm install
# Start the dev server
npm run dev
# Open in your browser
→ http://localhost:3000
Enable the AI Chat Assistant
cp env.example .env.local→set OPENAI_API_KEY=sk-...→npm run dev
Supports any OpenAI-compatible provider (Azure OpenAI, Groq, Ollama…)
Open source · Apache 2.0 · Free to use and self-host